The transportation sector accounts for approximately 30% of carbon dioxide emissions in the US alone. As the United States and the rest of the world for that matter, continue to lean into the paradigm shift of BEV transportation, more and more countries, states, and their consumers must prepare. A new 2022 report from LeasePlan USA has measured a number of data factors and scored an EV readiness index for all of the US.
Table of contents
Background
LeasePlan is one of the world’s largest fleet management and mobility companies currently responsible for more than 1.8 million vehicles across over 30 countries. LeasePlan states on its website that the core of its business revolves around the management of a client vehicle’s entire lifecycle, handling everything from purchasing and maintenance, to reselling.
As a company heavily involved in transportation, it too has recognized the compulsory shift toward electrification to lower costs to consumers, but more importantly, lower global carbon emissions. So that’s the “why.” As LeasePlan points out, the question that remains for many is the “how?” and “when?” The company explains this and more in its EV Readiness Index report, new for the US:
Published every year since 2018, the Europe-centric version has provided valuable insight to many fleet managers. Now, new for 2022, is this USA-focused version of the EV Readiness Index. It provides a clear overview, across all 50 states (plus the District of Columbia), of five key factors for electrification: favorable state legislation and incentives, EV penetration, charger to vehicle ratio, charger availability, and climate suitability.
Scoring explanation
Now as you’ll see in the data tables and graphics below, LeasePlan did some math to calculate its EV Readiness Index for the US – it’s not just a table ranking the states from best to worst… although that is included below as well.
The index was based upon five factors:
- Favorable state legislation and incentives
- Percentage of EVs on the road
- Charger to vehicle ratio
- Charger availability
- Climate suitability for EVs
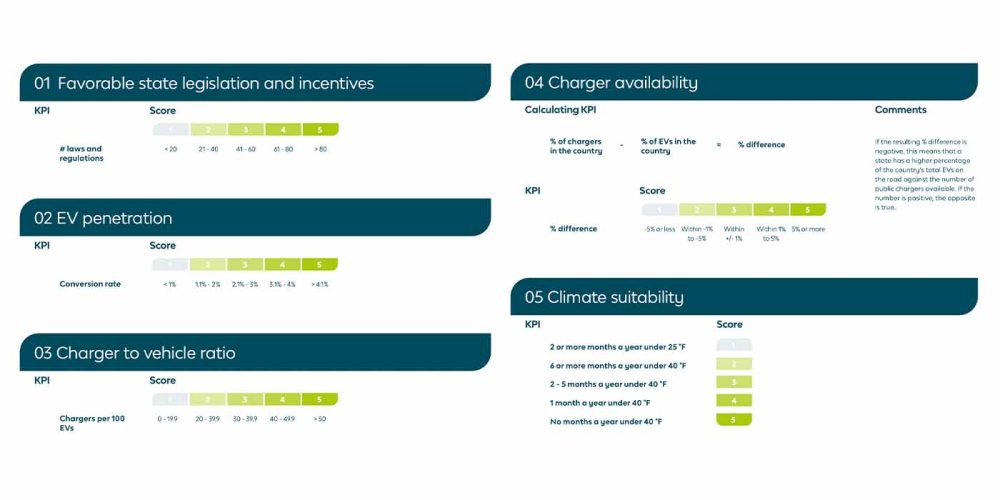
Those five factors were then scored individually for each of the 50 United States and DC based upon the following scoring systems:

Lease Plan then took all five factor scores and weighed each by assessing both the short- and long-term impact to EV readiness in the state. So it’s not a simple added up total of the factors, but rather a weighted grade divided into the following categories for an overall countrywide ranking:
| Total Overall Score | 0-10 | 10-14.9 | 15-19.9 | 20-25 |
| EV Readiness (US) | Least EV Ready | EV Progressive | EV Accepted | EV Ready |
So how does your state stack up? Maybe you’re in Mississippi and know there aren’t a lot of incentives out there for EV drivers right now so you’re worried. Or perhaps you’re out in Cali and are thinking The Sunshine State will be numero uno yet again, based on the sheer number of EV laws, incentives, and vehicles on roads… so. many. vehicles… everywhere.
The answers, my friends, may surprise you, as it’s like we said – this is not a simple top 51 ranking for the US. LeasePlan’s EV Readiness Index delves much much deeper.
EV readiness index in the US by state
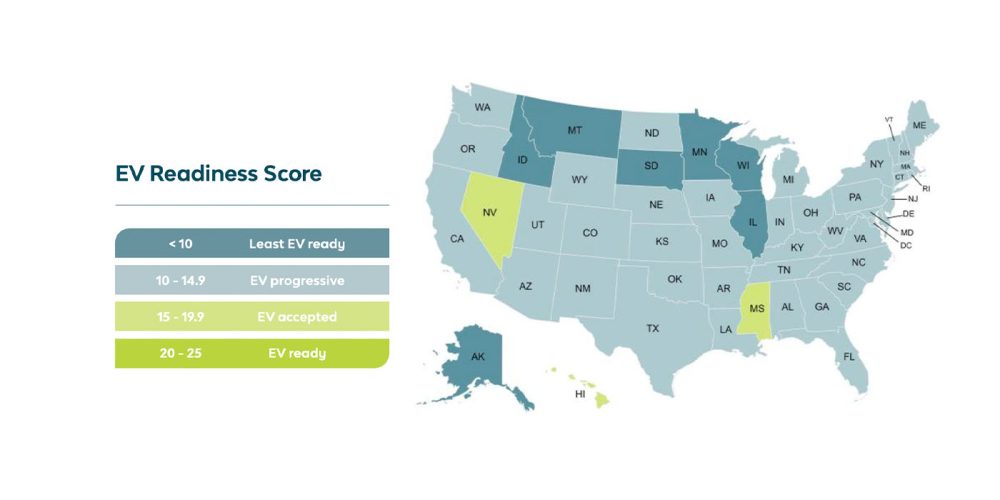
Let’s kick things off with a spoiler alert just to manage expectations from the get-go. Not a single US territory came close to ranking as “EV ready” under LeasePlan USA’s scoring system. In fact, some of the most progressive and eco-conscious states didn’t even crack the top 10.
Before we go any further, it’s important to note that this index is simply a sign of the times for 2022 and remains perpetually fluid, even as we write this. The top-ranking states are not necessarily the best locations for EV adoption, but rather the most prepared to handle an influx of new EVs today. Have a look:

Surprised? We are about to shock you further, because you see those three key-lime-colored states above? Those are the only three that qualified as “EV accepted” according to LeasePlan standards, and they barely qualified!
Let’s break it down a bit further below, but we know you’ve read far enough and want to see the full EV readiness rankings for the US, so here you go:
| Rank | State | Laws & Incentives | EV Penetration | Charger to Vehicle Ratio | Charger Availability | Climate Sustainability | Total Score |
| 1 | Nevada | 2 | 2 | 1 | 3 | 5 | 15.50 |
| 2 | Mississippi | 1 | 1 | 3 | 3 | 5 | 15.00 |
| 2 | Hawaii | 1 | 3 | 1 | 2 | 5 | 15.00 |
| 4 | Massachusetts | 2 | 2 | 2 | 4 | 3 | 14.50 |
| 4 | California | 5 | 3 | 1 | 1 | 5 | 14.50 |
| 6 | North Carolina | 2 | 1 | 1 | 3 | 5 | 14.25 |
| 7 | South Carolina | 1 | 1 | 1 | 3 | 5 | 14.00 |
| 7 | Alabama | 1 | 1 | 1 | 3 | 5 | 14.00 |
| 7 | Georgia | 1 | 1 | 1 | 3 | 5 | 14.00 |
| 7 | Louisiana | 1 | 1 | 1 | 3 | 5 | 14.00 |
| 7 | Arizona | 2 | 2 | 1 | 2 | 5 | 14.00 |
| 12 | Missouri | 1 | 1 | 3 | 4 | 3 | 13.50 |
| 12 | New York | 3 | 1 | 2 | 4 | 3 | 13.50 |
| 14 | Wyoming | 1 | 1 | 5 | 3 | 3 | 13.00 |
| 15 | District of Columbia | 1 | 2 | 2 | 3 | 3 | 12.75 |
| 15 | Texas | 2 | 1 | 1 | 2 | 5 | 12.75 |
| 17 | West Virginia | 1 | 1 | 4 | 3 | 3 | 12.50 |
| 17 | Colorado | 2 | 2 | 1 | 3 | 3 | 12.50 |
| 17 | Tennessee | 1 | 1 | 1 | 3 | 4 | 12.50 |
| 17 | Florida | 1 | 1 | 1 | 2 | 5 | 12.50 |
| 21 | Utah | 1 | 2 | 1 | 3 | 3 | 12.25 |
| 22 | Kansas | 1 | 1 | 3 | 3 | 3 | 12.00 |
| 22 | Maine | 1 | 1 | 3 | 3 | 3 | 12.00 |
| 22 | Rhode Island | 1 | 1 | 3 | 3 | 3 | 12.00 |
| 22 | Arkansas | 1 | 1 | 3 | 3 | 3 | 12.00 |
| 26 | Iowa | 1 | 1 | 2 | 3 | 3 | 11.50 |
| 26 | Oklahoma | 1 | 1 | 2 | 3 | 3 | 11.50 |
| 28 | Connecticut | 2 | 1 | 1 | 3 | 3 | 11.25 |
| 28 | Maryland | 2 | 1 | 1 | 3 | 3 | 11.25 |
| 28 | Virginia | 2 | 1 | 1 | 3 | 3 | 11.25 |
| 31 | Michigan | 1 | 1 | 1 | 3 | 3 | 11.00 |
| 31 | Ohio | 1 | 1 | 1 | 3 | 3 | 11.00 |
| 31 | Nebraska | 1 | 1 | 1 | 3 | 3 | 11.00 |
| 31 | Indiana | 1 | 1 | 1 | 3 | 3 | 11.00 |
| 31 | Pennsylvania | 1 | 1 | 1 | 3 | 3 | 11.00 |
| 31 | New Hampshire | 1 | 1 | 1 | 3 | 3 | 11.00 |
| 31 | Delaware | 1 | 1 | 1 | 3 | 3 | 11.00 |
| 31 | Kentucky | 1 | 1 | 1 | 3 | 3 | 11.00 |
| 31 | New Mexico | 1 | 1 | 1 | 3 | 3 | 11.00 |
| 31 | New Jersey | 2 | 2 | 1 | 2 | 3 | 11.00 |
| 31 | Oregon | 2 | 2 | 1 | 2 | 3 | 11.00 |
| 31 | Washington | 2 | 2 | 1 | 2 | 3 | 11.00 |
| 43 | Vermont | 2 | 2 | 3 | 3 | 1 | 10.50 |
| 44 | North Dakota | 1 | 1 | 5 | 3 | 1 | 10.00 |
| 45 | Illinois | 1 | 1 | 1 | 2 | 3 | 9.50 |
| 46 | South Dakota | 1 | 1 | 3 | 3 | 1 | 9.00 |
| 47 | Montana | 1 | 1 | 2 | 3 | 1 | 8.50 |
| 48 | Wisconsin | 2 | 1 | 1 | 3 | 1 | 8.25 |
| 48 | Minnesota | 2 | 1 | 1 | 3 | 1 | 8.25 |
| 50 | Alaska | 1 | 1 | 1 | 3 | 1 | 8.00 |
| 50 | Idaho | 1 | 1 | 1 | 3 | 1 | 8.00 |
Breaking down the top three most EV-ready states
It’s lonely at the top for some, but it’s important to recognize how LeasePlan came to its top three podium of US EV readiness.
Nevada
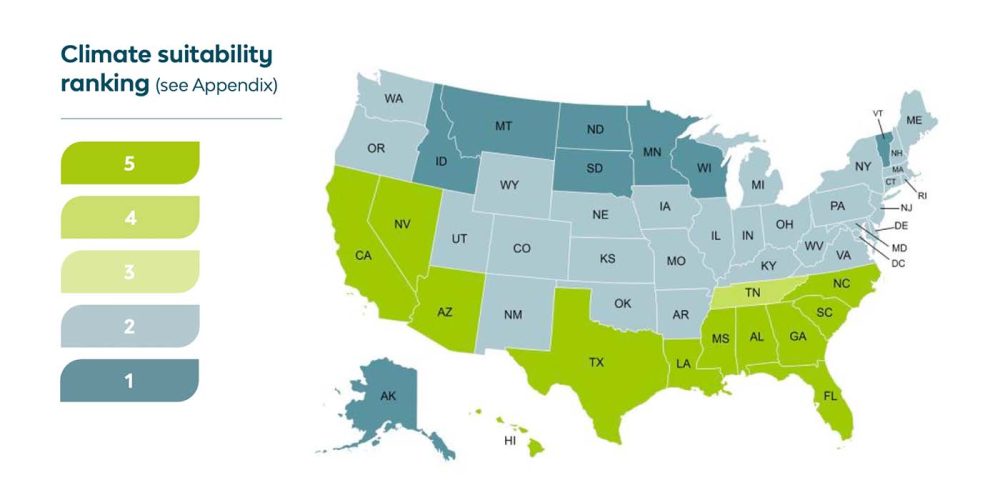
The Battle Born State wins the contest of EV readiness for 2022 thanks to decent marks in legislation, EVs on roads, and charger availability, but the main focus here should be its top score in climate sustainability (keep that in mind). Based on its warm desert climate, Nevada scored high in supporting the efficiency and longevity of EVs, more specifically, their battery chemistry.
In recent years, the state has also made commitments to improving public EV infrastructure, including the construction of the Nevada Electric Highway along US-95 between Reno and Las Vegas. Nevada ranked #1 despite an abysmal score for factor 3 (chargers per 100 EVs). The state will certainly need to improve upon 12 chargers per 100 EVs if it wants a chance to win back-to-back in 2023.

Mississippi
No offense to The Magnolia State, but we did not expect to see it in the top 10, let alone the top two! As you can see from the data tables in the full LeasePlan EV Readiness Index, Mississippi by far has the lowest EV penetration in the US. We’ve seen similar results in other past studies. It also only has five laws and incentives in place to support EVs, another discouraging mark.
However, the state scored quite well in factors three, four, and five based upon number of chargers, climate to support EVs, and the ratio of chargers to EVs. We do want to focus on that last factor for a second because it’s a little misleading. Mississippi offers a ratio of 36 chargers per 100 EVs, but that loses a little of its zest when there are less than 800 EVs (0.08% of the entire country’s total) residing in the entire state. Those Mississippi drivers must love those short charger wait times though!
Nevertheless, Mississippi is preparing for more electric vehicles on its roads. The state recently signed on to implement a network of DC fast-charging stations connecting major highway systems from coast to coast as part of the National Electric Highway Coalition (NEHC).
Hawaii
Mahalo indeed. Hawaii gets respect for cracking the top three in EV readiness. Not too shabby for a state surrounded by ocean in all directions. The Aloha State tied Mississippi for #2 on the EV Readiness Index despite scoring differently in its factors. Like its podium partners, its score of 5 in climate sustainability really helped seal its top spot as a heavily weighted factor expected to invoke speedier EV adoption for consumers.
Contrary to its southern ally, Hawaii scored high marks in EV penetration, with zero-emission vehicles making up over 2% of all vehicles on roads in the state and over 1% of EVs in the entire US. Where Hawaii needs work is in its EV-friendly legislation and its vehicle to charger ratio. The latter makes sense given the relatively small amount of roads compared to many other states, but it will need to bolster its infrastructure, especially if its penetration rate continues.
Final thoughts on the EV Readiness of the US
In closing, the US is not ready for widespread adoption of EVs, but that isn’t to say it isn’t on its way. Remember that LeasePlan’s EV Readiness Index is not an end-all score for the US – and it, like many data studies, is not perfect.
That being said, it does point out how much climate in the US has already had on EV adoption and how much more quickly we can predict it to grow in those warmer states. EVs in cold weather are definitely possible these days, but their efficiencies still pale in comparison to warmer conditions.
Many states also lack the legislation and/or incentives to help boost EV adoption for its residents. This can really help speed things up while giving consumers a great deal, so it would be nice to see those expanded since it has done well for states that have used government to promote the electrified transition.
All in all, this is one of the more thorough data indexes we’ve seen, and there is plenty more here we didn’t cover. We recommend giving LeasePlan USA’s EV Readiness Index a full look to see how your state stacks up in each category.
In 2023, it could be cool to compare how the EV landscape has changed in each state and in the US as a whole. Until then.
US EV Readiness Data sources
Below are the resources used by LeasePlan USA to gather data for its EV Readiness Index for 2022.
- Factor 1 sources
- Laws and incentives count – Alternative Fuels Data Center
- Laws and incentives list – Alternative Fuels Data Center
- Factor 2 sources
- Number of EV registrations – Experian Information Solutions
- Total vehicle counts – Federal Highway Administration
- Factor 3 sources
- Number of chargers – Alternative Fuels Data Center
- Number of EV registrations – Experian Information Solutions
- Factor 4 sources
- Number of EV registrations – Experian Information Solutions
- Factor 5 sources
- Average state temperatures – Weatherspark
- Miscellaneous sources – Check out the full LeasePlan report
FTC: We use income earning auto affiliate links. More.


Comments