
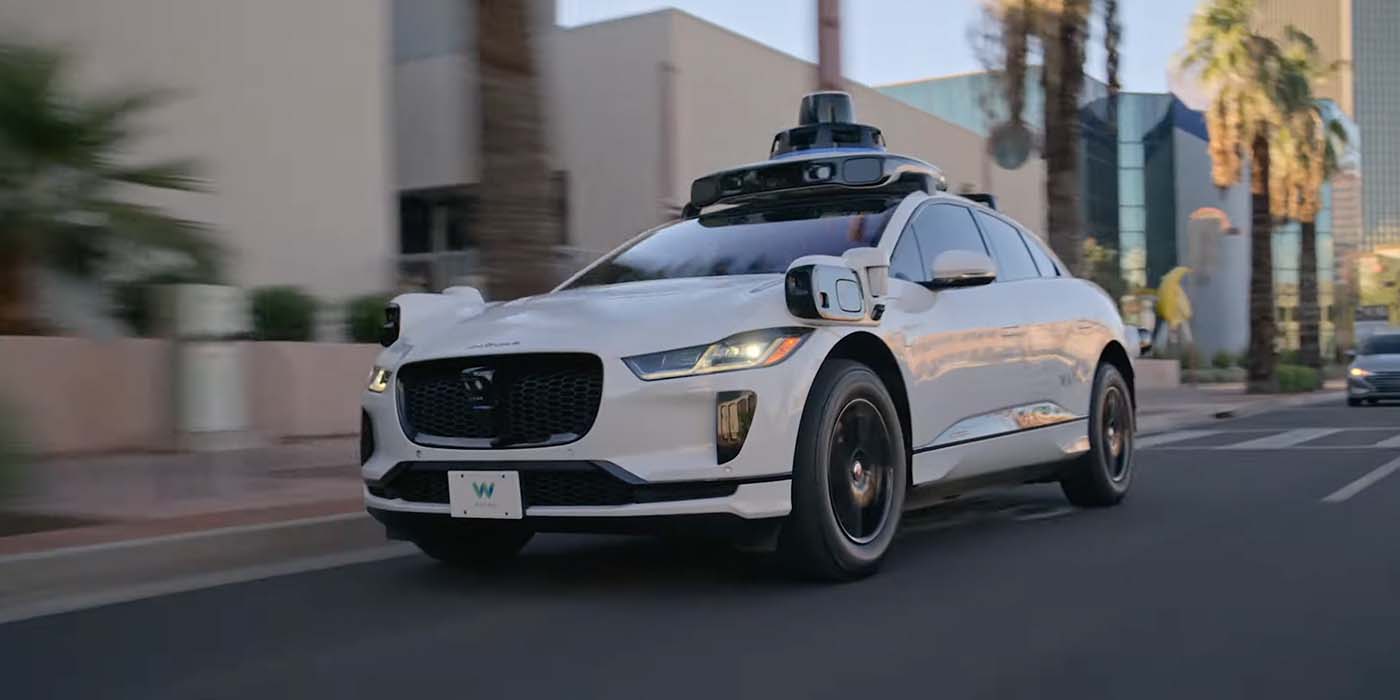
Waymo’s autonomous electric taxis crash 68% less than the average human driver, according to the Insurance Institute for Highway Safety, with lower-severity crashes on average as well. But there are some important caveats that limit the data.
In recent years, we’ve seen a proliferation of companies offering autonomous taxi services with “level 4” automation – the ability to operate with no driver in the car, at least in a limited (geofenced) area.
The leader among these services has been Waymo, a subsidiary of Google’s Alphabet, Inc.
It now offers autonomous ride-hailing services in 11 US cities, covering a total area larger than a US state (okay, that state is Rhode Island… well, it’s a start).
It has provided tens of millions of trips so far, which gives us an opportunity to examine the data and see how well these robots can actually drive.
And it turns out… they’re pretty good. With some caveats.
IIHS finds Waymo 68% safer than an *average* human
The Insurance Institute for Highway Safety, famous for its “Top Safety Pick” crash safety recommendations, examined federal crash reporting data for various robotaxi services from 2021-2024. It focused on Waymo, because while others are in the data set, Cruise stopped operations in 2023 and Zoox only began offering public rides in 2025.
Tesla, also, is not reflected in the 2021-2024 data set, as it only began offering its Austin “robotaxi” in 2025 (with drivers in the car at the time), and has only racked up 380,000 total unsupervised miles as of this week.
After cleaning up the data of redundancies and determining severity of crashes, the IIHS said that Waymo resulted in 68% fewer crashes severe enough that the average person would report them to the police, over a sample of 50 million miles driven autonomously by Waymos during the study period.
Per million vehicle miles traveled, humans crashed 4.06 times, and Waymos crashed 1.28 times.
The crashes recorded by Waymos tended to be less severe than human crashes, and tended to not be the fault of the Waymo.
Interestingly, despite Waymo using radar and LiDAR, both of which don’t rely on visible light, Waymo had a higher share of crashes in dark conditions than human drivers did.
The results carried across three of the four study areas – Phoenix, San Francisco, and Los Angeles. However, Waymo actually had a slightly higher crash rate than humans in Austin, possibly due to the very small sample size of miles driven during the study period, as the company was still testing and not publicly available there yet in 2024 (and may have been rushing to beat Tesla to the punch).
Waymo has released other studies before showing similar data about crash safety. A 2023 study said Waymo vehicles reduce injury-causing crashes by 85% and police-reported crashes by 57%, and a 2025 study said Waymos are 25x safer for pedestrians and cyclists. Both of those studies were publicized by Waymo and submitted for peer review, but given the researchers were Waymo employees, it doesn’t hurt to have more independent confirmation. (Tesla, by comparison, has released its own internal numbers, but doesn’t subject them to independent scrutiny – it needs more miles for that, after all)
The study had its limitations
The discussion portion of the study brings up several important points. First, it harps on the crash database, saying that more data is needed to make studies like these easier, as much of the effort of this study was spent on cleaning up the data and classifying crashes and locations.
For one, companies are required to report crashes, but aren’t required to report miles driven autonomously, which makes crash frequency impossible to analyze – unless they voluntarily report miles driven, as Waymo does.
And while humans aren’t required to report fender benders to police, autonomous companies are. So IIHS had to remove minor fender benders and scrapes from the data set, which is going to introduce some subjectivity.
Another is the concept of an “average human driver.” Should we even be comparing a robot, which theoretically can operate at peak capacity 24/7, against human drivers who are often tired, stressed, rushed, overworked, impaired, distracted and so on? If the human average is brought down by drunk drivers, then comparing a Waymo to a drunk person isn’t all that impressive. We should be comparing robotaxis to optimal-expected human driving, to see if they’re better than humans can and should be, rather than better than humans are.
And, how does the difference in human driven versus robot-driven miles manifest itself in expected crash rates?
Waymo, for example, does not operate on highways, so highway miles were excluded from the study for both human and robo-drivers. Highways are a simpler domain and have much lower crash rates than city streets, so excluding them from the human dataset makes human drivers look worse – but then, Waymo isn’t in that simpler domain either, so it’s fair.
Waymo also tended to operate on lower-speed streets than human drivers, even discounting highways. Half of Waymo’s crashes happened on streets with speed limits under 25mph, whereas only 8% of human crashes happened here. This could account for why Waymo showed lower crash severity than humans, since it was getting into lower-speed crashes. Lower speeds are a good thing, but this could be making Waymo’s crash rate look lower than it is.
Another driver of crash severity is whether or not anyone is injured in a crash. That will naturally be lower with autonomous taxis, since nearly half of Waymo’s miles were driven with no humans in the car. If there’s no human in the car, then a human can’t get injured in the car (though humans in other cars, or pedestrians, are still out there).
This could be considered a benefit, because fewer humans being involved in crashes is good… but it also means there are more cars driving around transporting nobody and nothing, which could potentially result in higher traffic congestion, which then drives more collisions at a population level.
Top comment by Anupreet Singh
I'll say this is not all that positive for Waymo as well. But I guess they'll eventually get there.
The part that's most puzzling is the increase in crash rate in the dark. I dread to think about vision only approach in the same environment, but lidar and radar ought to help. That tells us how important the software is. Even if you have sensor data, model training and correct decision making is very important.
And finally, despite Waymo’s much higher number of unsupervised miles driven than the competition (~50,000,000 miles from 2021-2024, compared to Tesla’s total ~380,000 unsupervised miles all time as of this week, and none in the study period), the sample size is still a little low. A lot of crash types had a total of 0 or 1 crashes logged, which is bound to give weirdly spiky data. A larger dataset will average out to being more reliable, and less influenced by individual incidents.
In contrast, Human drivers drive over 3 trillion miles per year in the US, and drove about 222 billion miles in the study areas over the same period of time. That’s enough miles to get representative data.
So there’s still a ways to go before we can truly answer the question of autonomous car safety, but from the data we’ve seen so far, the red flags are at least not nearly as large as the popular conception might suggest.
Charge your electric vehicle at home using rooftop solar panels. Find a reliable and competitively priced solar installer near you on EnergySage, for free. They have pre-vetted installers competing for your business, ensuring high-quality solutions and 20-30% savings. It’s free, with no sales calls until you choose an installer. Compare personalized solar quotes online and receive guidance from unbiased Energy Advisers. Get started here. – ad*


FTC: We use income earning auto affiliate links. More.




Comments