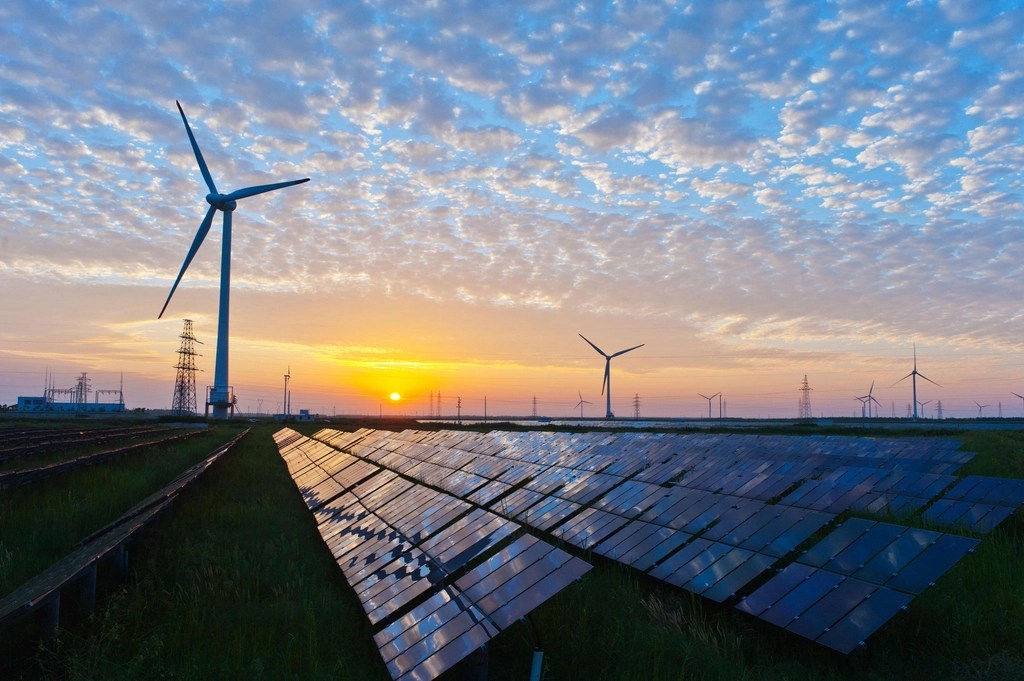
Renewables – solar, wind, biomass, geothermal, hydropower – are now 30% of total US electrical generating capacity, according to analysis of FERC’s mid-year data.
The Federal Energy Regulatory Commission (FERC)’s latest monthly “Energy Infrastructure Update” (with data through June 30, 2024), which was reviewed by the SUN DAY Campaign, also reported that June was the 10th month in a row in which solar was the largest source of new capacity. That puts solar on track to become the US’s second-largest source of capacity – behind only natural gas – within three years.
FERC says renewables were 99% of new generating capacity in June and 91% in H1 2024. 37 “units” of solar totaling 2,192 megawatts (MW) were placed into service in June along with one unit of hydropower (34 MW). Combined, they accounted for 98.9% of all new generating capacity added during the month. Natural gas and oil provided the balance: 20 MW and 5 MW, respectively. (Generating capacity is not the same as actual generation.)
During the first half of 2024, solar and wind added 13,072 MW and 2,129 MW, respectively. Combined with 212 MW of hydropower and 3 MW of biomass, renewables were 91.2% of capacity added. The balance consisted of the 1,100 Vogtle-4 nuclear reactor in Georgia plus 369 MW of gas, 11-MW of oil, and 3-MW of “other.”
Solar was 97% of new capacity in June and 77% during H1 2024. The new solar capacity added in the first half of 2024 was more than double the solar capacity (6,446 MW) added year-over-year. Solar accounted for 77.4% of all new generation placed into service in the first half of 2024.
New wind capacity in the same period accounted for most of the balance – 12.6% – which was slightly less than that added year-over-year (2,761 MW).
In June alone, solar comprised 97.4% of all new capacity added, followed by hydropower (1.5%). Solar has now been the largest source of new generating capacity for ten months straight: September 2023 – June 2024. For seven of those 10 months, wind took second place.
Solar plus wind are now more than a one-fifth of US generating capacity. The combined capacities of just solar and wind now constitute more than 20.7% of the US’s total available installed utility-scale generating capacity.
However, a third or more of US solar capacity is in the form of small-scale (e.g., rooftop) systems that isn’t reflected in FERC’s renewables data. Including that additional solar capacity would bring the share provided by solar + wind closer to a quarter of the US’s total.
Solar’s share of US generating capacity advances it to fourth place. The latest capacity additions have brought solar’s share of total available installed utility-scale (that is, >1 MW) generating capacity up to 9%, further expanding its lead over hydropower (7.8%). Wind is currently at 11.8%. With the inclusion of biomass (1.1%) and geothermal (0.3%), renewables now claim a 30% share of total US utility-scale generating capacity.
Installed utility-scale solar has now moved into fourth place – behind natural gas (43.3%), coal (15.8%), and wind – for its share of generating capacity after having recently surpassed that of nuclear power (8%).
Solar will soon become the second largest source of US generating capacity. FERC reports that net “high probability” additions of solar between July 2024 and June 2027 total 88,526 MW – an amount almost four times the forecast net “high probability” additions for wind (23,851 MW), the second fastest growing resource.
FERC also foresees growth for hydropower (1,240 MW), geothermal (400 MW), and biomass (90 MW). There’s no new nuclear capacity in FERC’s three-year forecast, and coal, natural gas, and oil are projected to contract by 20,542 MW, 3,106 MW, and 1,629 MW, respectively.
If FERC’s current “high probability” additions materialize, by July 1, 2027, solar will account for more than one-seventh (14.8%) of the nation’s installed utility-scale generating capacity. That would be greater than either coal (13.3%) or wind (12.7%), and substantially more than either nuclear power (7.5%) or hydropower (7.4%). That means the installed capacity of utility-scale solar would move into the No. 2 spot behind natural gas (40.3%).
Meanwhile, the mix of all renewables would account for 36.3% of total available installed utility-scale generating capacity – rapidly approaching that of natural gas – with solar and wind constituting more than three-quarters of the installed renewable energy capacity.
If small-scale solar systems are taken into account, within three years, total US solar capacity is likely to approach – and very possibly surpass – 300 GW. In turn, the mix of all renewables would then exceed 40% of total installed capacity, while the share of natural gas share would drop to about 37%.
Ken Bossong, the executive director of nonprofit research and educational organization SUN DAY Campaign, said:
With each passing month, renewables – led by solar – expand their contribution to the nation’s electrical capacity.
Growing from just a fraction of one percent a decade ago, solar is now nearly a tenth of US utility-scale generating capacity and poised to reach 15% within three years.
Read more: US power grid boosts capacity by 20.2 GW in the first half of 2024
To limit power outages and make your home more resilient, consider going solar with a battery storage system. In order to find a trusted, reliable solar installer near you that offers competitive pricing, check out EnergySage, a free service that makes it easy for you to go solar. They have hundreds of pre-vetted solar installers competing for your business, ensuring you get high-quality solutions and save 20-30% compared to going it alone. Plus, it’s free to use and you won’t get sales calls until you select an installer and you share your phone number with them.
Your personalized solar quotes are easy to compare online and you’ll get access to unbiased Energy Advisers to help you every step of the way. Get started here. –trusted affiliate link*
FTC: We use income earning auto affiliate links. More.


Comments