
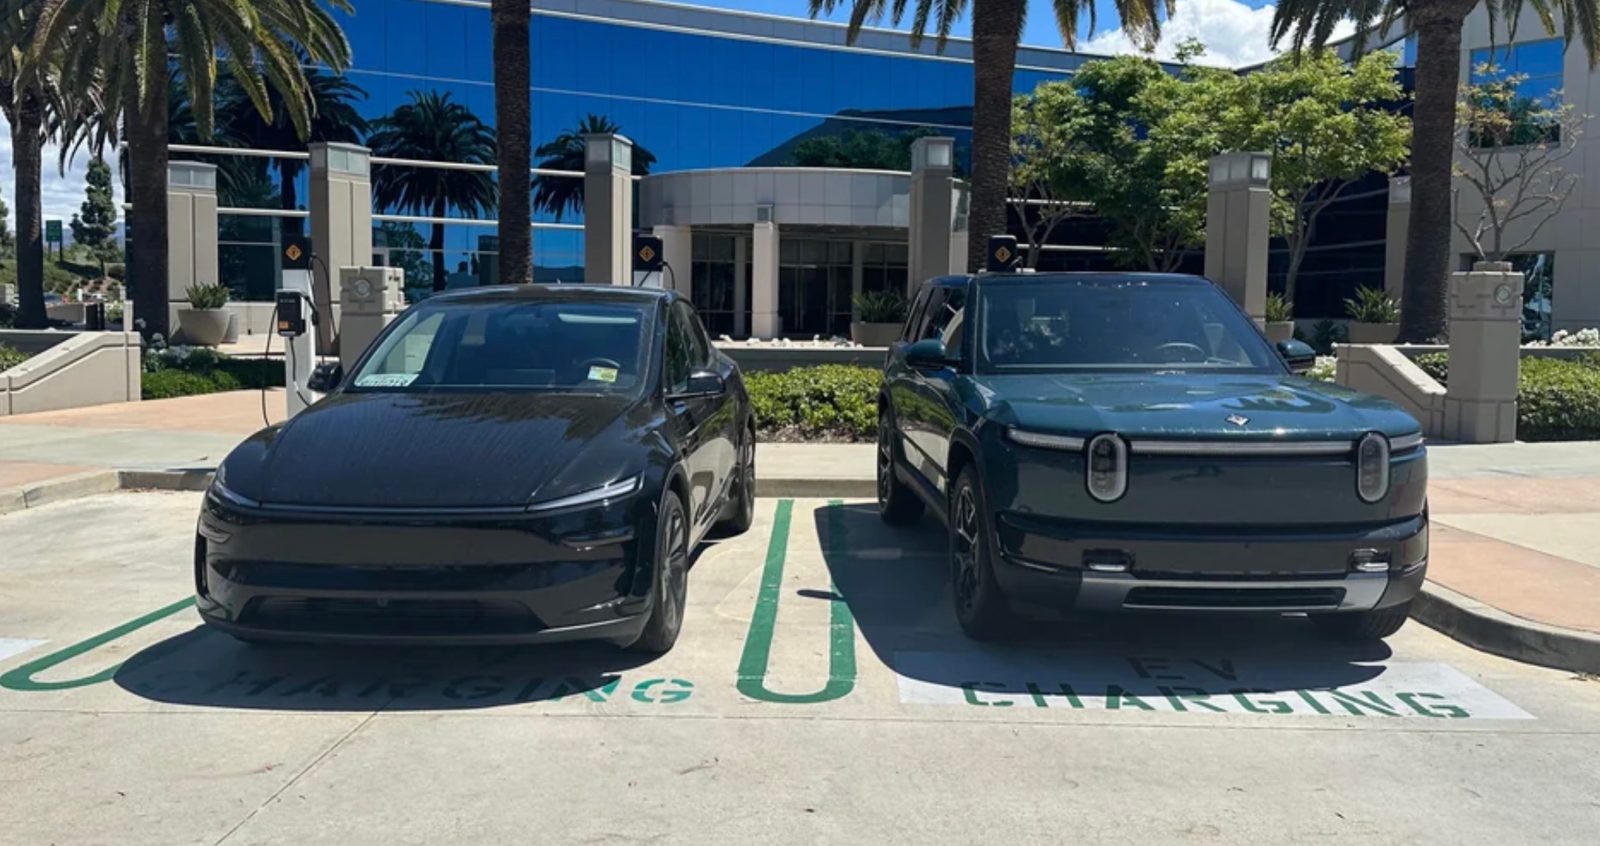
Out of Spec Reviews put a Rivian R2 Performance and a Tesla Model Y Performance on the same roads on the same afternoon. The R2 used 18% to 26% more energy at every single speed they tested.
That’s awkward, because the two SUVs carry identical EPA efficiency ratings, and Rivian CEO RJ Scaringe has been telling media the R2 matches the Model Y.
What the EPA numbers say
We covered the ratings when they landed in May: the R2 Performance matches the Model Y on EPA efficiency at 105 MPGe combined and 32 kWh per 100 miles. The R2 wins the city cycle 114 to 111. The Model Y wins the highway cycle 100 to 96. And the R2 goes further on a charge, 330 miles against 306.
For a vehicle that weighs roughly 800 lbs more and has the aerodynamic profile of a shoebox, that’s a real engineering achievement.
Scaringe leaned into it at the R2 launch. Asked about the front drive unit disconnect, he told assembled media the R2 is “as efficient on a Wh per mile or miles per Wh basis despite the capabilities it has and despite the form factor that we’ve intentionally chosen to provide the level of utility that it has.”
But EPA ratings are lab numbers. And they rarely match real-world experience.
EPA lets automakers choose their own test
This part doesn’t get explained often enough, so here it is.
EPA gives EV manufacturers more than one path to a range and efficiency label. The cheap path: run the car on the city cycle until the battery is depleted, run it on the highway cycle until the battery is depleted, then multiply range and fuel economy by 0.7 to approximate real-world driving. EPA’s own guidance says most EVs use that method.
The expensive path is the multi-cycle test: four city cycles, two highway cycles, and two constant-speed cycles, which actually measures cold-weather, hot-weather and high-speed behavior instead of estimating it with a blanket factor. Automakers can also petition EPA for a derived five-cycle method or for adjustment factors based on in-use data. Both require EPA approval.
So a car that runs the longer, costlier test can earn a better correction factor than the flat 0.7. Out of Spec’s Kyle Conner believes that’s what happened here, with Rivian running the R2 through the full procedure at a lab in Michigan while Tesla submitted derived numbers. He says on camera that he can’t certify it, and neither can we. Per-vehicle test paths aren’t published anywhere the public can easily check them, which is its own problem.
There’s a second wrinkle nobody talks about. EPA’s kWh/100 miles figure is measured at the wall, so it includes charging losses. Out of Spec measured energy leaving the battery. Back the label math out and EPA is effectively saying the R2 does about 3.75 miles per kWh from the pack while the Model Y Performance does about 3.64 — EPA has the R2 slightly ahead, and testing put it 18% to 26% behind.
That gap is the whole story.
The side-by-side
Methodology first, because it’s the only thing that makes a comparison like this worth reading.
Both SUVs sat until the packs cooled to ambient. Tires set to 42 PSI cold with the same gauge. Climate on auto at 68°F with rear vents off, two occupants per vehicle, screens dimmed, no phone charging. R2 in Conserve, Model Y in Chill. Out-and-back loops at 50, 60, 70 and 80 mph GPS, with the cars swapping the lead each leg so neither one drafted. The two odometers disagreed by about 1.7%, so the comparison ran on kWh consumed rather than the cars’ own efficiency readouts.
Here’s how much more energy the R2 used at each speed, with its own efficiency in brackets:
- 50 mph: 18.4% more (4.00 mi/kWh)
- 60 mph: roughly 26% more (3.15 mi/kWh)
- 70 mph: roughly 20% more (3.06 mi/kWh)
- 80 mph: 26.5% more (2.46 mi/kWh)
The 70 mph result breaks the trend, and Conner explains why on camera: that loop ran on I-95 at 5 p.m. in heavy traffic, with both cars picking up slipstream from trucks. Treat it as the soft data point.
Then they built a low-speed city simulation, which is where Rivian’s argument should be strongest. The R2 decouples its front motor with a clutch, so crawling around town it spins one drive unit. The Model Y’s front induction motor keeps turning and paying windage and gear-train losses. Over a 20-minute stop-and-go loop the Model Y used 1.6 kWh and the R2 used 1.9, about 19% worse in the exact scenario built to favor it.
The charging is the good news
The second video ran Out of Spec’s 10% Challenge: charge from 10% state of charge for exactly 15 minutes, then drive at a constant 80 mph until you’re back to 10%.
The R2 charges well. Really well. Plugged into an IONNA Rechargery in Wilson, North Carolina, it held a flat 600 amps, everything the Alpitronic hardware could deliver, all the way to 32% state of charge, peaking around 229 kW. It added 48.3 kWh in 15 minutes for a 193 kW average, going from 10% to 59%. The car asks for up to 630 amps, meaning it was charger-limited rather than battery-limited for that entire window. For a 400-volt architecture, that’s about as good as it currently gets.
Then it drove 92.8 miles at 2.2 mi/kWh. The Model Y Performance, run two days earlier, managed roughly 103 miles at 3.3 mi/kWh on considerably less added energy, because it charges badly and cruises brilliantly.
Electrek’s Take
We wrote the May story off the EPA filings, and those filings said what they said. We’re not walking that back. What this testing exposes is a rating system that let two widely different vehicles land on the same combined number, and then a highway that reminded everyone shapes still matter.
One test day isn’t the last word, and we’d say that even if the result had gone the other way. Out of Spec used in-car energy meters instead of measuring at the charger, ran everything in summer heat on a single day, and had one of four loops compromised by traffic.
Top comment by Beario
After watching the video, I don't think anything in the video will change anyone's mind about either vehicle. Conner does a great job detailing both vehicles and considering he has driven almost everything EV, he has a lot of valuable information.
But directionally, this is what R2 owners are going to live with, because nobody actually drives the EPA city cycle. People drive 75 on the interstate. At 80 mph the R2 is a 2.2-to-2.5 mi/kWh vehicle and the Model Y is a 3.1-to-3.3 mi/kWh vehicle, and that’s not a rounding error. It makes sense based on the aerodynamic profiles of each vehicle.
The more useful framing is that Rivian made a trade, and it’s a defensible one. The R2 charges better than almost any 400-volt EV you can buy. And while the form factor is much less efficient than the Model Y, it’s also much more SUV, with an emphasis on utility, than Model Y.
We came away impressed by the R2 in our first drive, and this doesn’t change that, but it’s an important data point to consider if you are on the market for a R2. The efficiency figures from the EPA are likely inflated.
This would be a change for Rivian because in general, I found myself more likely to hit EPA efficiency in the R1s than in almost any Tesla vehicle I’ve driven.
If you’re shopping an EV like the R2 or the Model Y, powering it with home solar cuts your fuel costs to nearly nothing. With electricity rates up almost 10% last year and expected to keep climbing, going solar is one of the best ways to protect yourself against rising costs. And with lease and PPA options, you can do it with zero upfront cost and start saving immediately. If you want to find the best deal, check out EnergySage. It’s a free service with hundreds of pre-vetted installers competing for your business, so you save 20 to 30% compared to going it alone. No sales calls until you pick an installer. Get your free quotes here.


FTC: We use income earning auto affiliate links. More.


Comments